Since the installation of Sql Server 2016 Service Pack 1, on some of our customers with hi-end machines, we started seeing a couple of issues performance related, which sometimes caused the server to slow down, and in some circumstances almost hang. With the term hi-end I refer to boxes with more than 48 physical cores and an amount of RAM ranging from 1Tb to 2Tb, running at 40K batches/sec and more with a rate of several thousands of Sql Transactions/sec.
We never had such kind of issue with either 2014 or 2016RTM and in that period we were introducing further optimizations on both the Web code and the Stored Procedures, to further reduce resource utilization.
The faced issues basically were:
- a huge amount of latch contention of type ACCESS_METHODS_ACCESSOR_CACHE, sometimes being the higher percentage of the day and with situations of many seconds of wait time,
- Repeated episodes of heavy locks of type COMPILE, lastinng for 30/40s and even more
- An increased CPU comsumption with the same load and usage pattern we were used to.
We started loking at the performance counters and found that the Plan Cache was always very low, around 1Gb for both Procedure and Ad Hoc, with an increased rate of Compilations/sec and Recompilations/sec over the past. Tried to investigate for an increased number of statistics update events but nothing, no apparent reasons for the continuous evictios from the Plan Cache; the Compile locks and the ACCESS_METHODS_ACCESSOR_CACHE latch were the results of the “hard work” of the engine over the Plan Cache.
So started looking at the RING_BUFFER_RESOURCE_MONITOR, thinking something like “ok, if it is a memory issue I should find something about it there…” and found this..

Ok, system and process indicators were healthy, but the pool indicator was telling that some pool was suffering; how this can happen if the Plan Cache is already very low and the Buffer Pool was fine? That was my question…
So “asked” more details to the sys.dm_os_memory_clercks wich told
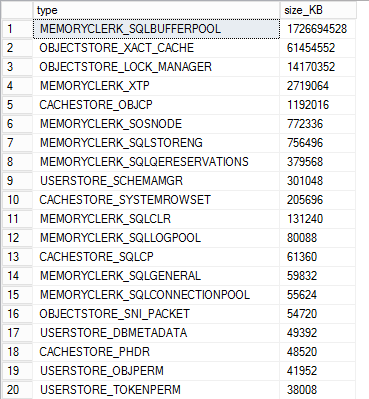
So what??? 60Gb for the _XACT_CACHE and 14Gb for the _LOCK_MANAGER ? This is a 2Tb box, so we know that on this box the cache pressure limit is around 107Gb (75% of visible memory from 0 to 4Gb + 10% from 4Gb to 64Gb + 5% > 64b ) and that notifications are raised when a single cache store reaches 62,5% of the above calculations -> 67Gb, so we were roughly on that range. On the image You can also see the _OBJCP and the _SQLCP cache stores to be very low.
We issued a DBCC FREESYSTEMCACHE(‘All’) and after a while the result was

The plan cache for object and adhoc quickly grew to the value we always saw in the past, the other cache stores greatly reduced their footprint and for some days we didn’t have neither notifications from the RING_BUFFER nor latches or compile lock.
To check the behavior of the _XACT_CACHE and the _LOCK_MANAGER stores we started collecting the output of the sys.dm_os_memory_clercks every hour and quickly saw the tipical memory leak behavior.
This is the output of a second box with 1Tb RAM, with the collection started just before a DBCC FREESYSTEMCACHE; the plan cache slowly comes to a steady value and then when the OBJSTORE_XACT_CACHE comes to around 25Gb Sql starts kicking out plans and allowing less room for them; we then identified the “deeps” of the graph to be in synch with our most evident issues.
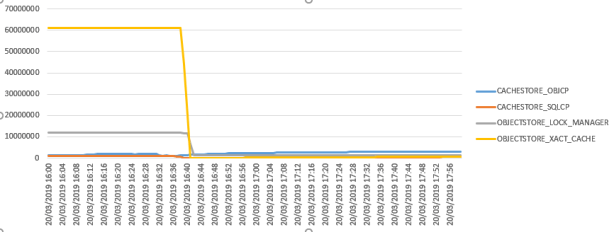
This is the graph created on the 2Tb box wich shows that as soon the OBJSTORE_XACT_CACHE is reduced the plan cache starts growing in value.
We decided to open a case with Microsoft support because it clealry seemed a memory leak, we never faced this issue till the installation of the SP1 for Sql 2016, and I never saw something similar during 15 years in the Sql Support Team…
MS told that nothing changed on that side starting with SP1 and suggested to try to implement Trace Flag 3920 to completely disable Transaction Cache; I’m not happy in completely disable it so by now we run DBCC FREESYSTEMCACHE(‘Transactions’) once a week and we don’t have those issues anymore.
However I still have my doubt for some regressions introduced by SP1…
Please feel free to contact me for further details or if you experienced a similar issue.
